

Moving Millions: What a Major International Soccer Tournament Teaches About Transportation Resilience
By Nishant Pareek
Earlier this summer, I attended a major international soccer match in Atlanta with my family. As we made our way into the city, I found myself paying attention to everything happening around the match. Roads were busy. Transit stations were full. Thousands of people were trying to reach the same destination at roughly the same time.
As someone who works in mobility analytics, I wondered what really happens when an entire region starts behaving differently for a single event.
That experience brought a real-world perspective to a question Michelin Mobility Intelligence was already examining through its Moving Millions: What Major Events Reveal About Transportation Resilience study. We examined tournament matches across seven host cities to understand how congestion, risk, and operations evolve during mega-events. Several clear patterns emerged.
Takeaway #1: The greatest impacts stay close to the venue
One of the strongest findings was that disruption was localized. Across host cities, the greatest impacts occurred within one mile of the venue.
In Atlanta, the most substantial slowdowns were concentrated around the stadium, with impacts dropping significantly beyond the venue core.
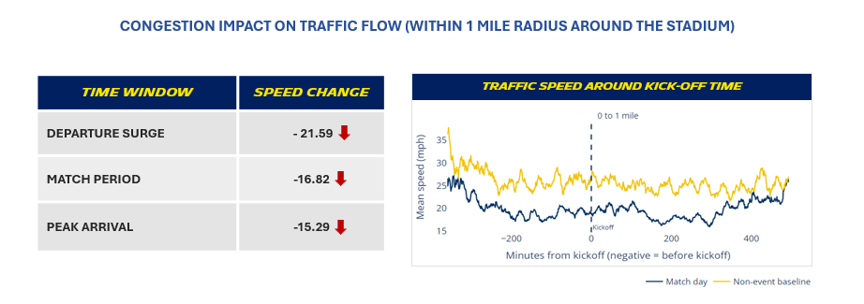
For agencies, this reinforces the importance of targeted planning. Rather than treating an entire metro area as equally affected, resources can be prioritized around the corridors and access points most likely to experience stress.
Takeaway #2: The real challenge begins after the event ends
Many people assume the biggest transportation challenge is getting fans to the venue. Our data suggests otherwise.
In Atlanta and other host cities, the most significant traffic impacts occurred during the departure period.
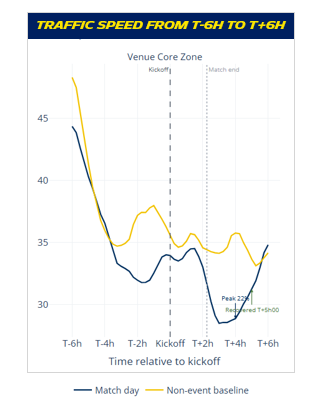
Peak is calculated by comparing match-day speed with normal-day speed at each 15-minute interval and finding the largest difference: it does not represent the highest or lowest speed on the chart.
For planners, that means the final whistle should not mark the end of operations planning. In many cases, it marks the beginning of the most demanding period.
Takeaway #3: Congestion, risk, and pedestrian exposure often overlap
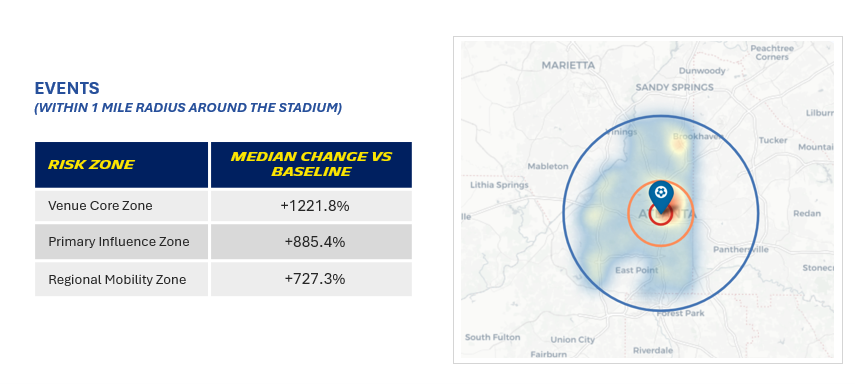
Traffic delays tell only part of the story. By analyzing harsh-braking activity alongside traffic conditions, we found that areas experiencing the greatest congestion often showed elevated behavioral risk signals as well.
Major events increase the number of people walking between venues, transit stations, rideshare locations, restaurants, and parking areas. When elevated pedestrian activity overlaps with congestion and risk signals, areas surrounding major venues become critical safety zones, not just traffic management zones.
Takeaway #4: Data helps agencies move from reaction to preparation
Perhaps the most important lesson from this study is that mega-event transportation impacts follow recognizable patterns. While every city is unique, agencies can use mobility intelligence to understand where pressure is likely to emerge, when it will peak, and where risks may affect both drivers and pedestrians.
Major events will continue to test transportation systems. With the right data and planning, agencies can better prepare for the travel demand they create.
The Moving Millions study helps agencies turn event lessons into practical transportation resilience and safety strategies. Read the full study here.

Comments are closed.